View a Scenario Run
After you begin running scenarios, you are brought to the run group page. This page has the project, scenario, and parameter set that you used to create the run group. It also has a list of each run in the group.
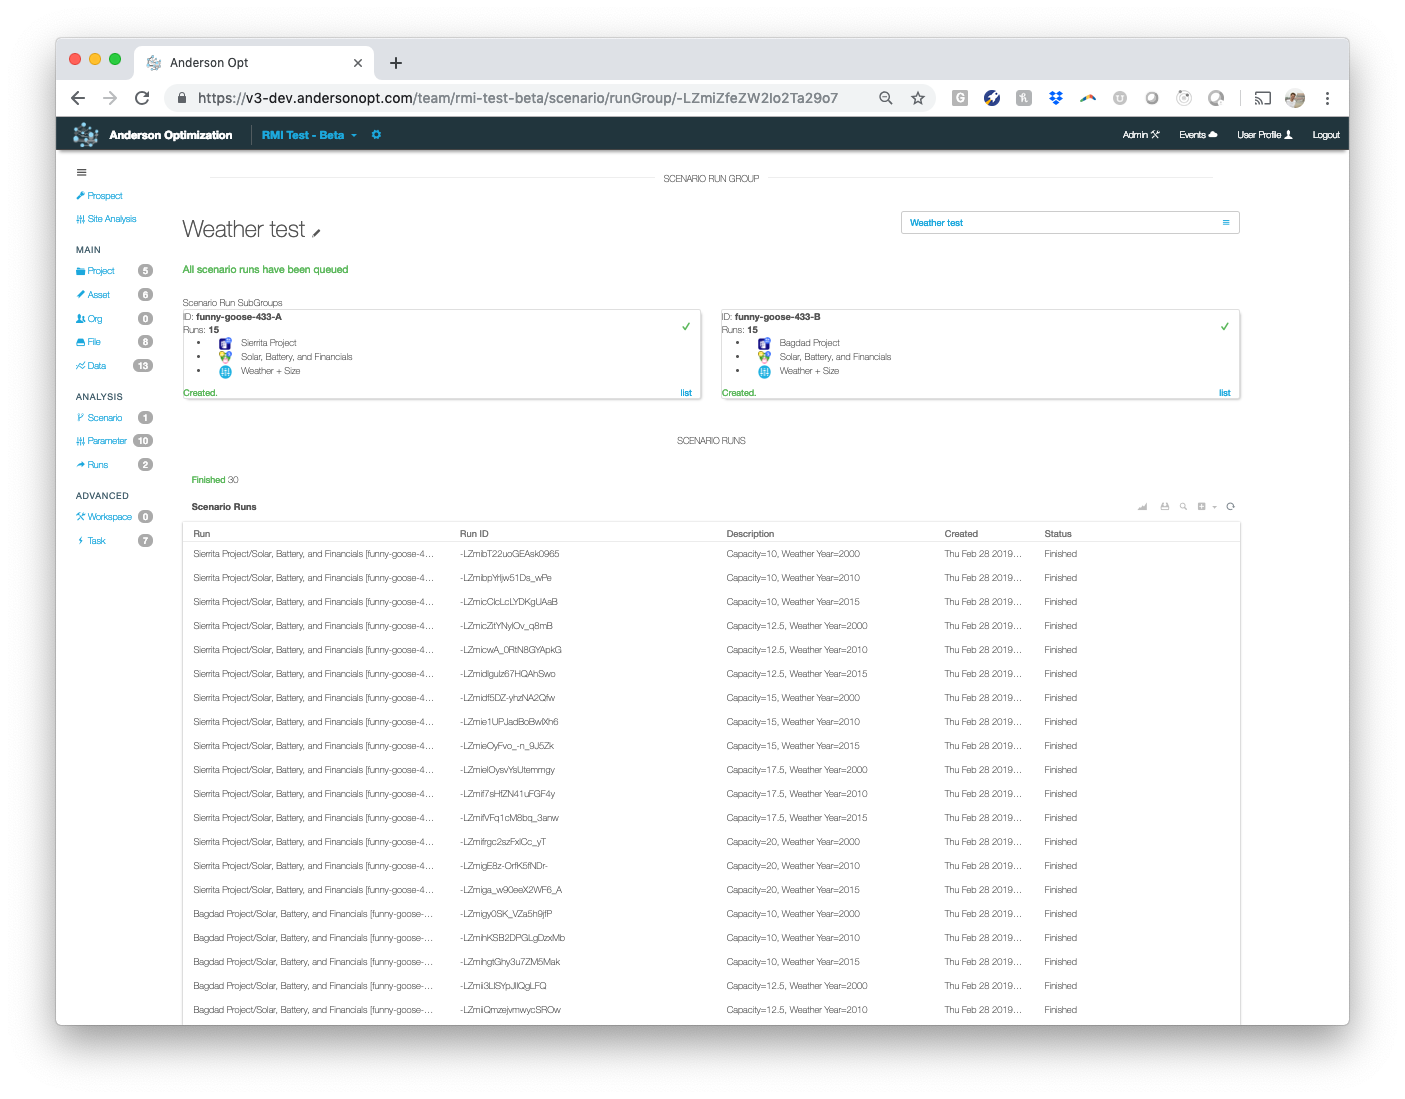
Scenario Runs Table
You can view and export the parameter output for each run in the Scenario Runs table.
Configure Columns
-
Click the configure colums dropdown in the toolbar above the top right corner of the scenario runs table.
- Select any parameters, and they will display in the table.
- You can sort by a certain column by clicking that column's header.

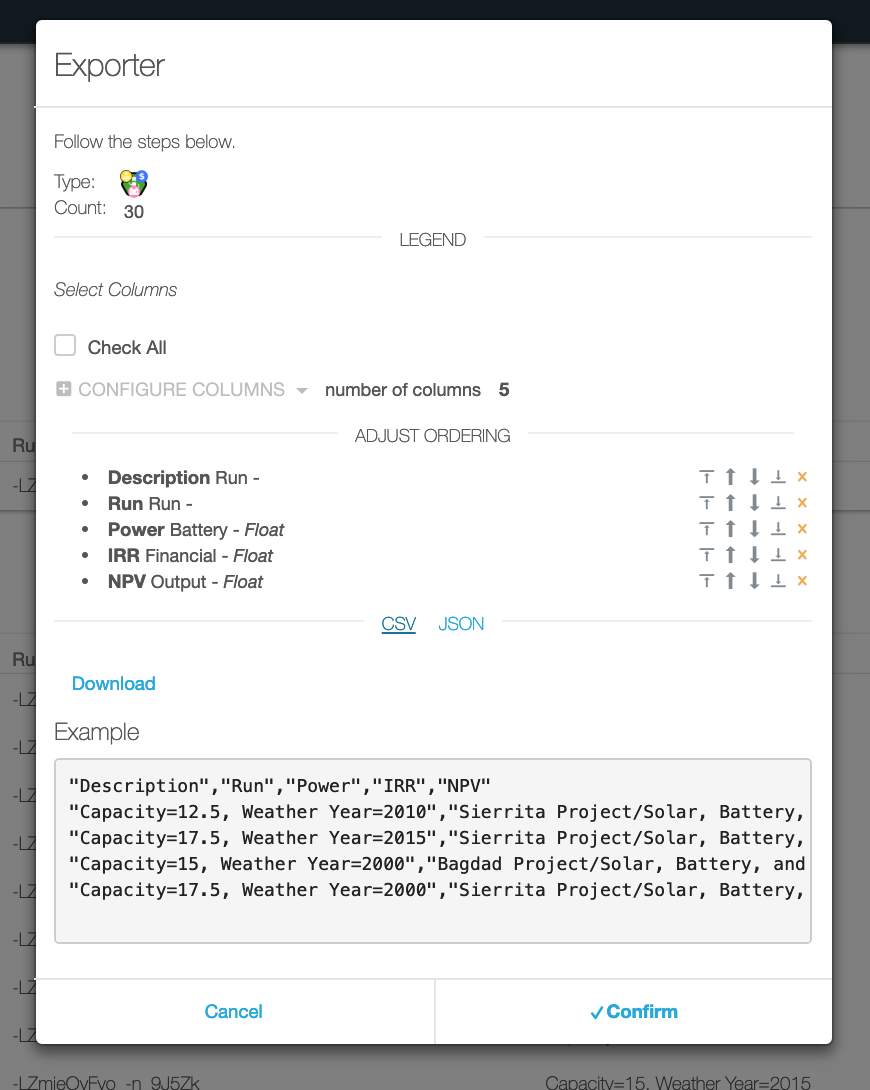
Export Data
- Click the export icon in the toolbar to display the exporter feature.
- Select the parameters you want to export.
- Click Check All if you want to export every parameter.
- Click the Configure Columns dropdown and select the parameters you want to export
- You can adjust the order of the columns by click Adjust Ordering and using the arrows in the table to organize the parameters.
- Click CSV to export in an Excel file
- Click Download
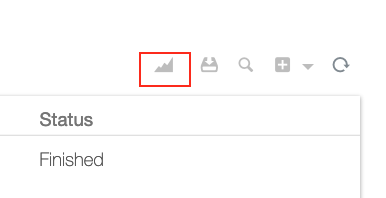
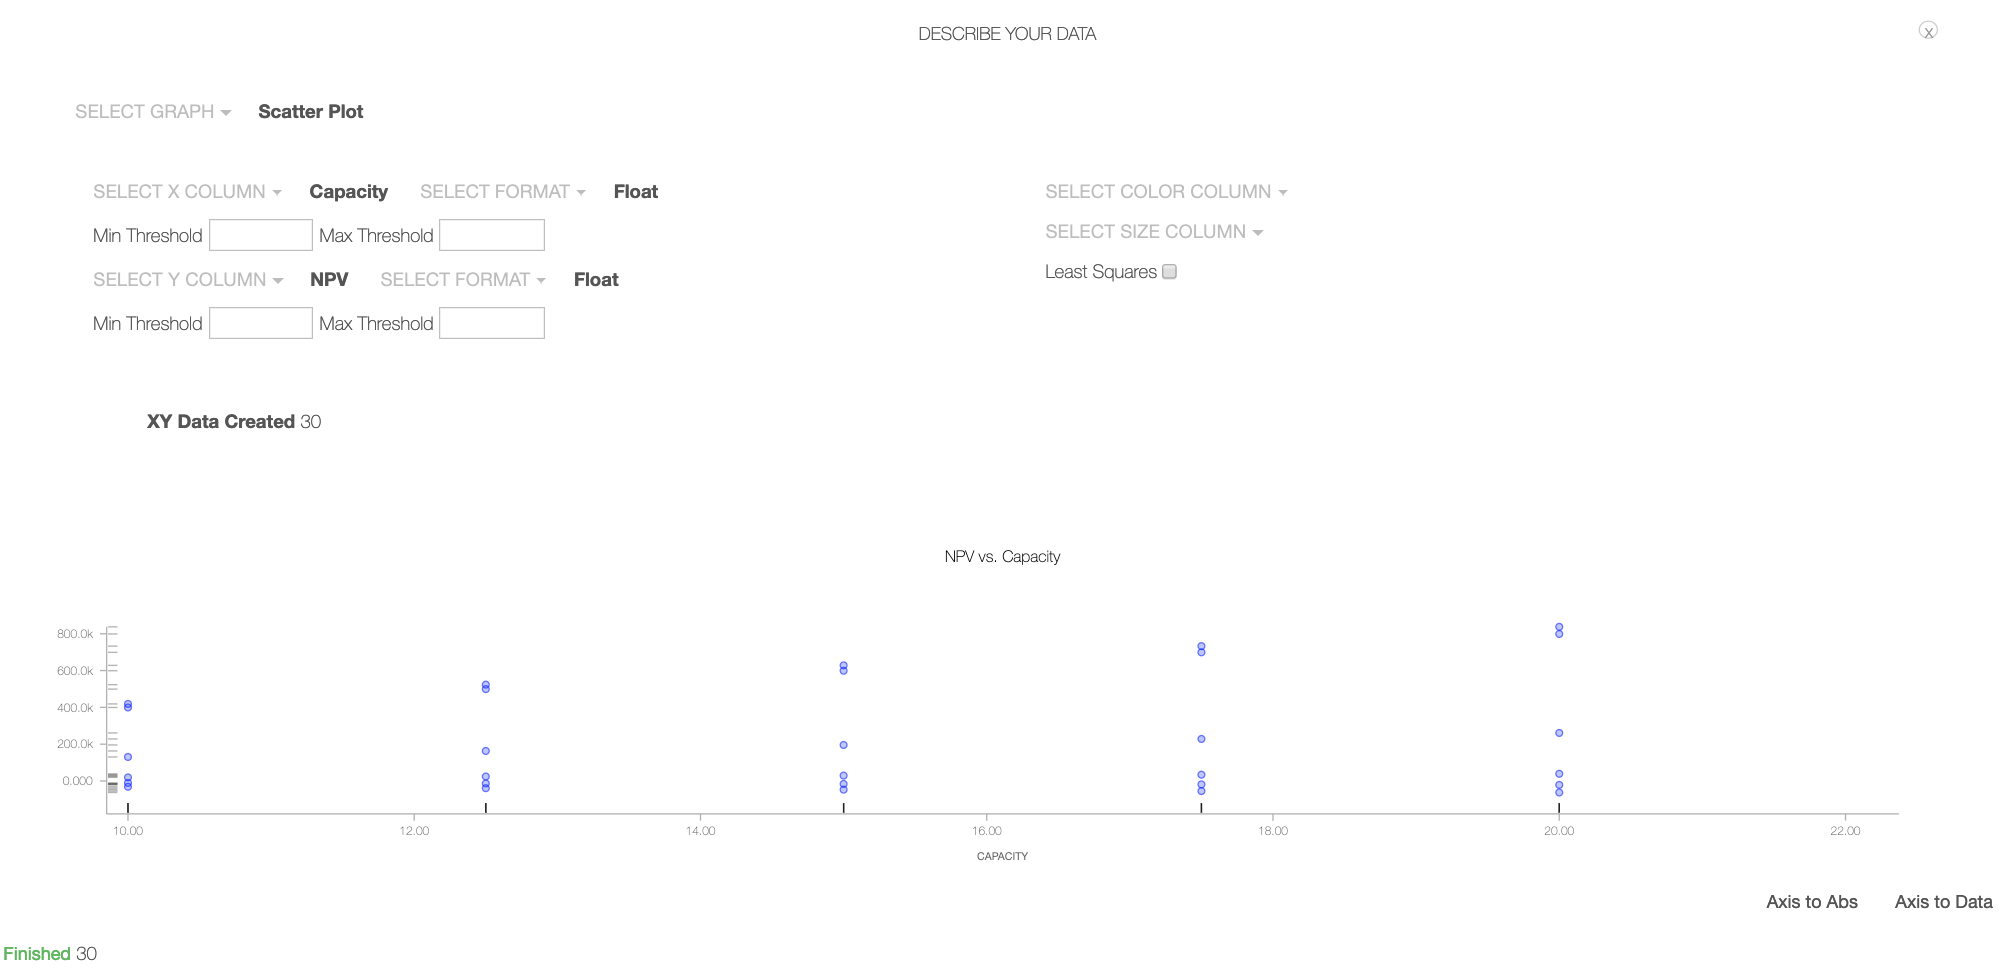
Graph Data
- Click the chart icon in the toolbar above the top right corner of the scenario runs table to open the graphing tool.
- Click the Select Graph dropdown and choose select a chart type.
- Click the Select X Column and Select Y Column dropdowns to set your X and Y axes.
- Hover over any data point to see its result.
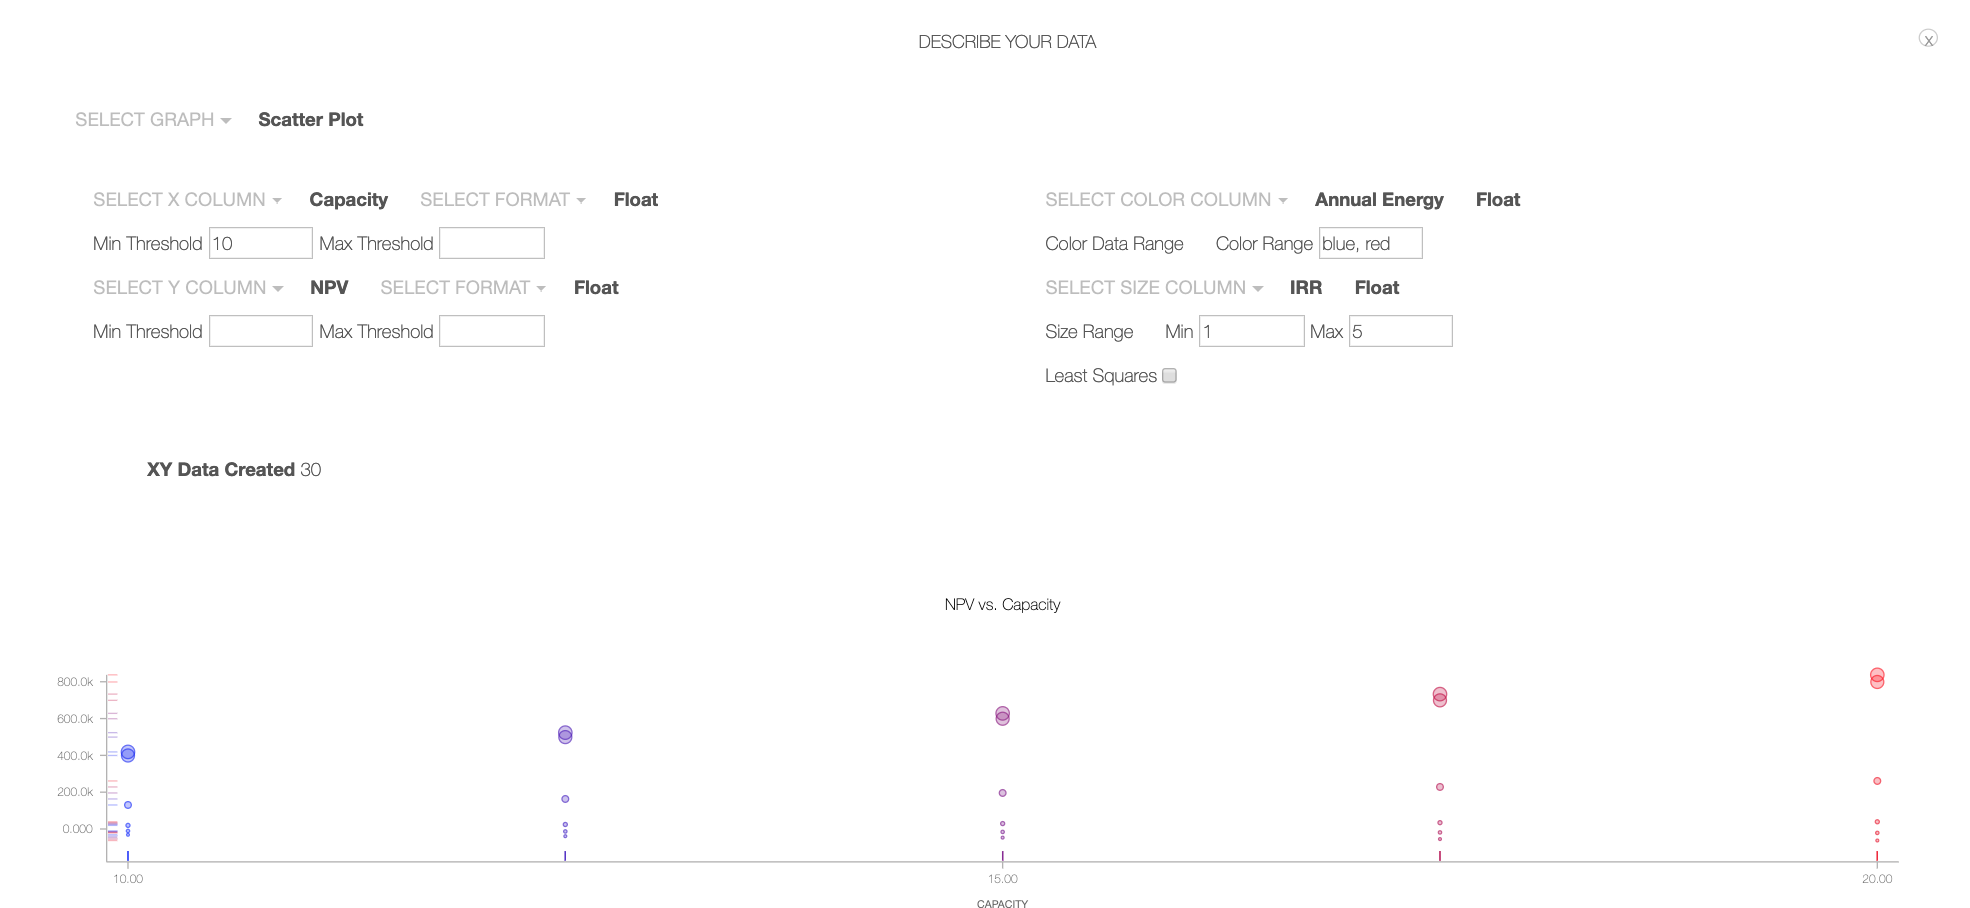
Manipulate Graphs
- The Min/Max Threshold input boxes allow you to edit the minimum and maximum values of either axis.
- The Select Color Column dropdown allows you to shade graph data from one color (low value) to another (high value) based upon a parameter.
- The Select Size Column dropdown allows you to adjust the data points' sizes from small (low value) to large (high value) based upon a parameter.
- The least squares check box creates a line of best fit.
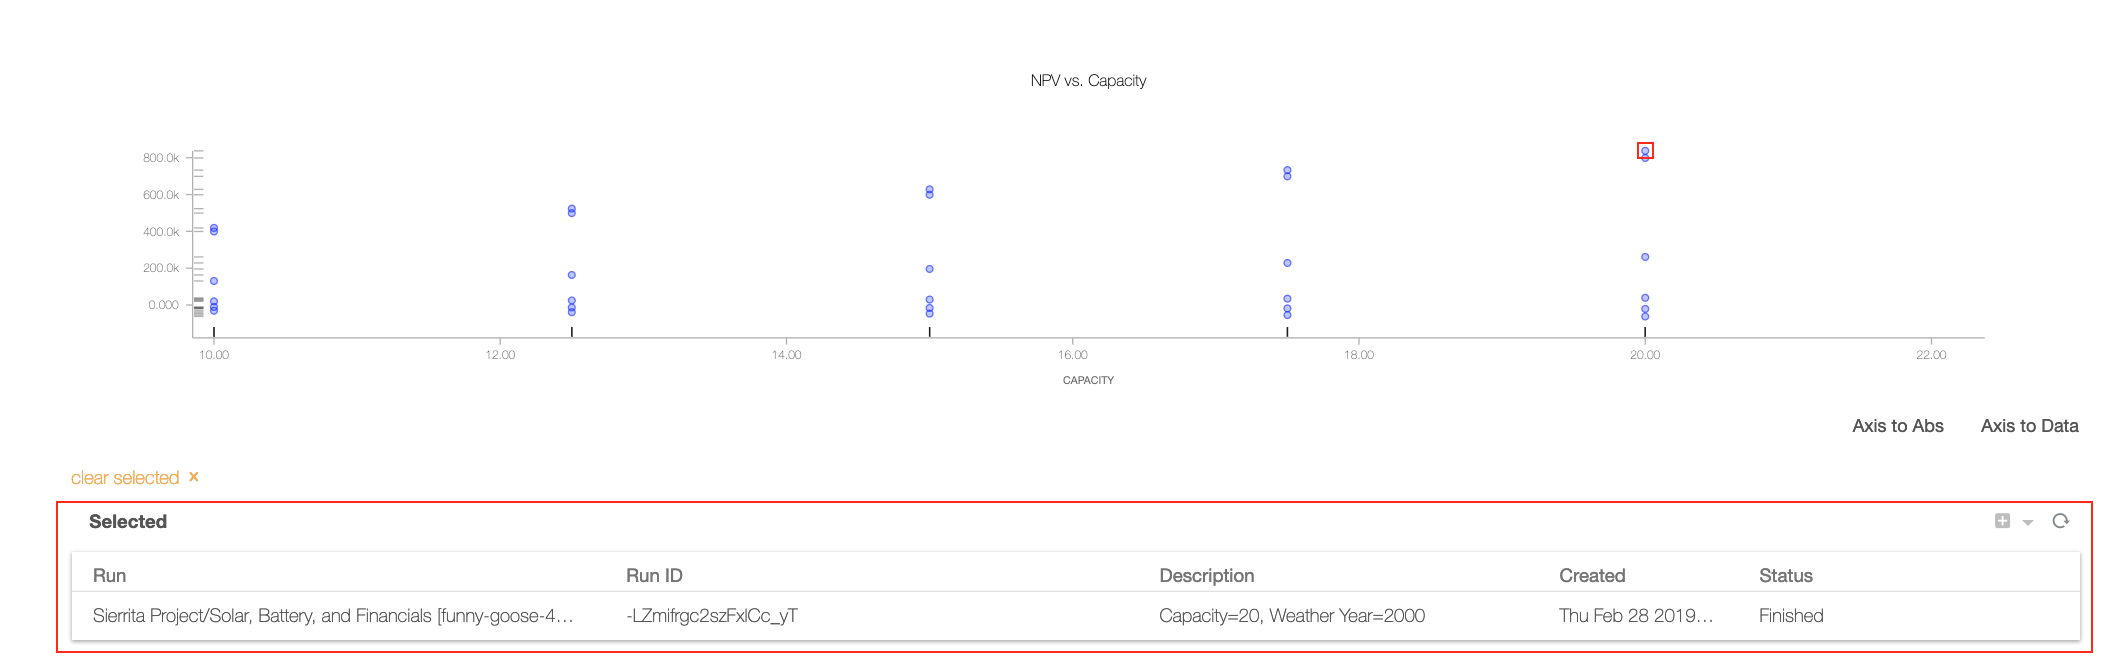
Identify Best Opportunities
- Assuming financial success is your primary goal, use NPV and/or IRR as one of your parameters.
- In the chart, click on the data points with the highest NPV (or other parameter of interest).
- When you click a data point, the run that it represents will appear in the Selected runs table.
- Click on the run to navigate to its run detail page where you can view the output data for that run.